 Aspire Budgeting
Using reports
Learn how to open Aspire's five reports, choose a date range, apply shared filters, read chart tooltips, and inspect transactions.
Updated August 10, 2026
Aspire includes five reports in the free add-on. They use the transactions already stored in your spreadsheet and give you different ways to understand the same financial activity.
Choose the report for your question
| Report | The question it answers |
|---|---|
| Spending | Where did my money go during this period? |
| Trends | How is category spending changing month by month? |
| Income vs Expense | Did I bring in more than I spent? |
| Budget vs Actual | How did actual spending compare with my current monthly targets? |
| Money Flow | How did outside income move through accounts into spending groups? |
Open reports
- Open the Aspire Budgeting add-on from your Google Sheet.
- Find Reports in the sidebar.
- Select any report.
The report opens in a large dialog. Use the tabs at the top to move among all five reports without returning to the sidebar.
Choose a date range
Open Date range and choose This Month, Last 3 Months, Last 6 Months, Last 12 Months, Year To Date, Last Year, or All Dates. Choose Custom range when you need specific starting and ending months.
The selected range applies to every report and stays active when you switch tabs.
Filter the report data
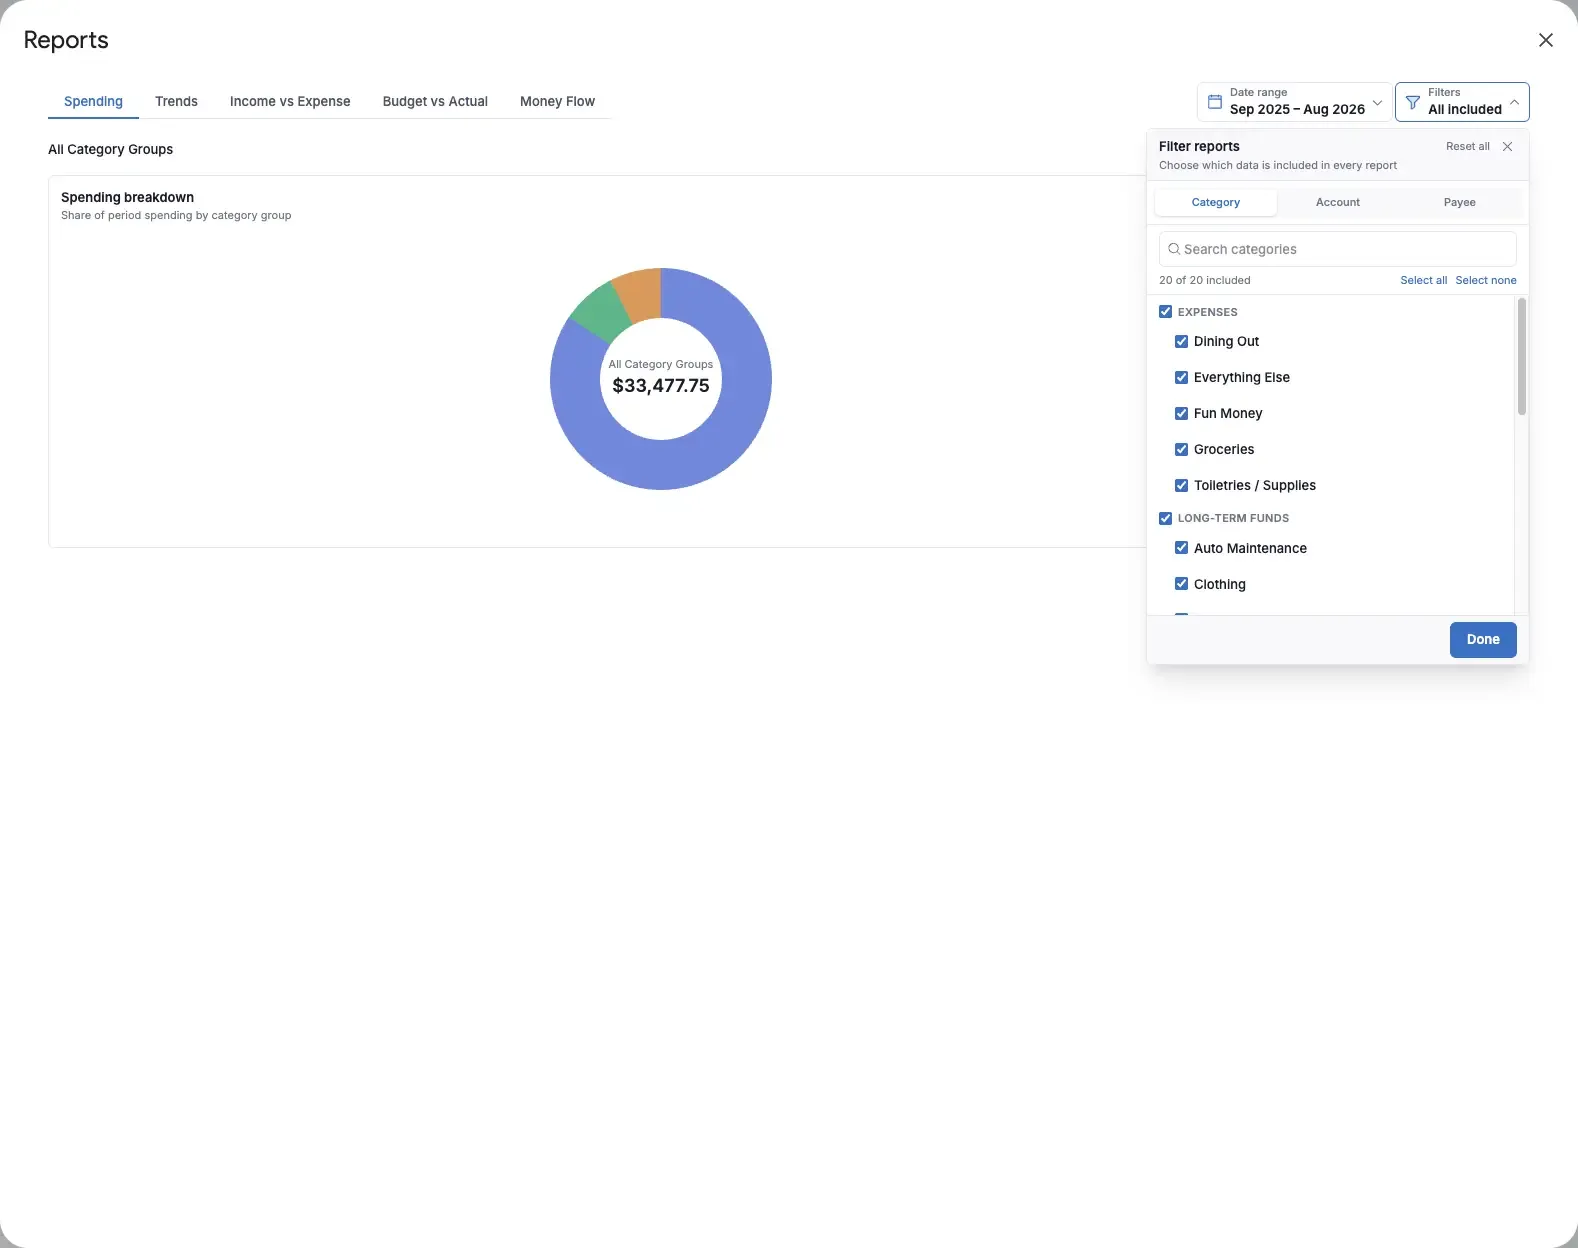
Open Filters to include or exclude data by:
- Category: Categories are indented under their category-group headings. A group control changes all of its categories together.
- Account: Include only the accounts relevant to your question.
- Payee: Focus on particular merchants or income sources. This option appears when your workbook has a Payee field.
Use the search field to find an option, or use Select all and Select none to change the visible choices quickly. The filter badge shows how many dimensions have active exclusions.
Filters apply to all five reports and remain active when you switch tabs. Active-filter labels appear above the report so you can see why a total may differ from the unfiltered workbook.
Use charts and transaction details
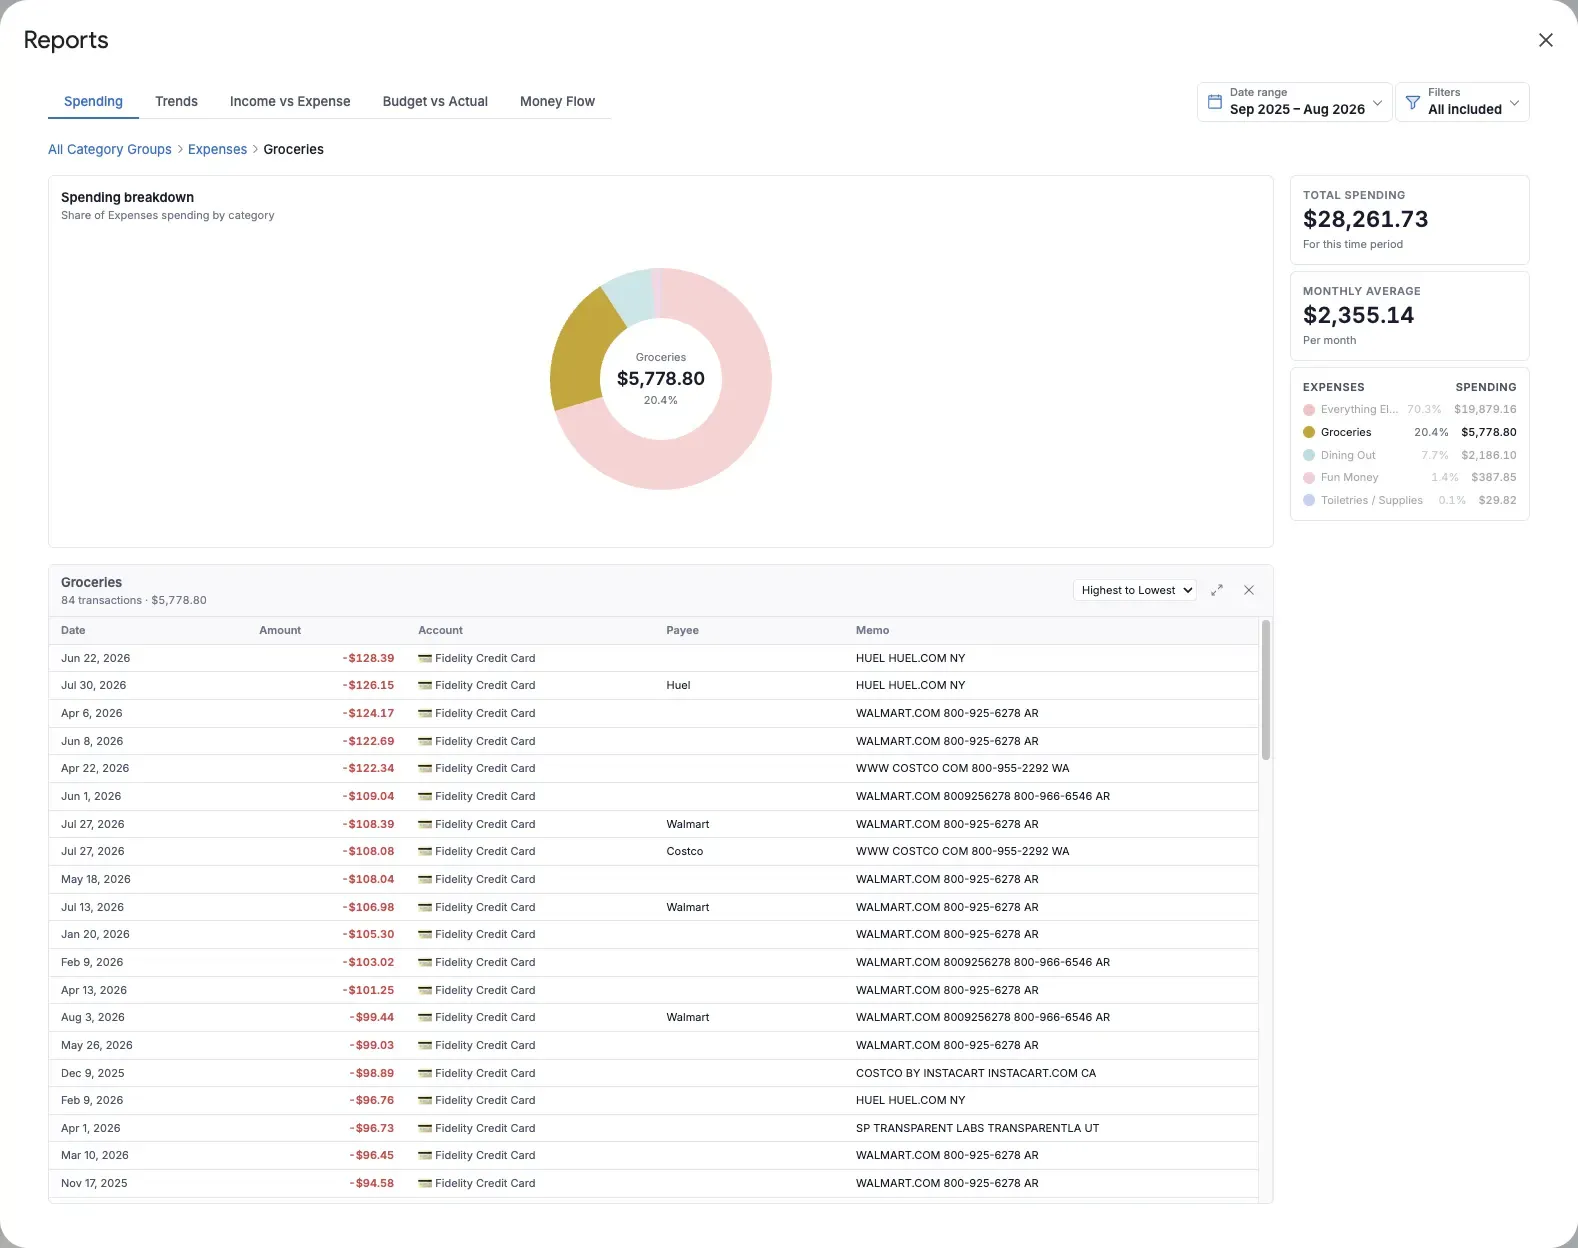
- Hover over a chart value to see its label and exact amount.
- Time-based charts use a vertical hover line so the active month is consistent across reports.
- Select an actionable chart value, list item, or table amount to open the transactions represented by it.
- Sort transaction details by date, amount, or name.
- Expand the transaction table when you want a full-dialog view.
- Close transaction details to return to the report without losing your date range or filters.
Reference values such as Budget, Net income, Balance used, and Net retained explain the chart but do not represent their own transactions.
Understand which transactions count
Reports exclude account transfers and balance adjustments so moving money between your own accounts does not appear as income or spending. Split transactions are counted by category without duplicating their account totals.
If a report looks incomplete, first check the active date range and filters. Then verify the transaction’s date, amount, category, and account in the Transactions sheet.
Keep reports responsive
Aspire loads the report data once when the dialog opens. Changing tabs, dates, or filters then happens locally. If you add or correct transactions, close and reopen Reports to load the updated spreadsheet data.