Recurring expense tracker
How the Recurring Expense Tracker detects subscriptions and recurring bills from your transaction history, and how confidence classifications are calculated.
Published June 18, 2026
Jump to a section
- How it works
- Confidence classifications
- Confirmed (score 85–100)
- Likely (score 70–84)
- Possible (score 50–69)
- Not shown (score below 50)
- How the confidence score is calculated
- Interval consistency (40% of score)
- Day-of-month consistency (30% of score)
- Amount consistency (20% of score)
- Occurrence count (10% of score)
- Memo bonus (up to 5 extra points)
- Frequency detection
- Why something might not appear
- Not enough transactions
- Subscription appears cancelled
- Timing is too irregular
- Category is too noisy
- Amounts vary too much within a cluster
- The summary cards
- Cost increase detection
- Transaction history
- Tips for better detection
The Recurring Expense Tracker automatically scans your transaction history to surface subscriptions, monthly bills, and other recurring charges. It works entirely from the data already in your spreadsheet — no manual tagging, no bank connection, no external services.
Requires Aspire Turbo. Recurring Expense Tracker is a subscriber-only feature available in the Aspire Budget add-on sidebar.
How it works
When you open Recurring Expenses from the sidebar, the add-on:
- Reads all outflow transactions from your Transactions sheet.
- Groups them by budget category.
- For low-volume categories (roughly one transaction per month), analyzes the entire category as a potential recurring expense.
- For high-volume categories (like “Dining Out” or “Everything Else”), clusters transactions by similar amounts and checks each cluster for recurring patterns.
- Scores each detected pattern using multiple signals and classifies it by confidence level.
The memo field is used only as a display label — it never drives detection. This means inconsistent memos (e.g., “Apple”, “APPLE.COM/BILL”, “iCloud”) won’t prevent detection as long as the transactions share a category and have consistent timing.
Confidence classifications
Each detected recurring expense is placed into one of three confidence tiers:
Confirmed (score 85–100)
The pattern is unmistakable. Transactions appear at highly consistent intervals, on similar days of the month, with stable amounts. Examples:
- A $55 Google Fiber charge on the 14th–16th of every month
- A $2.99 iCloud Storage charge on the 5th–7th of every month
- A fixed $200 donation on the same date each month
Likely (score 70–84)
The pattern is clear but has some noise. The timing might drift, the amount might vary slightly, or the day of month isn’t perfectly consistent. Examples:
- A monthly tithe that lands anywhere from the 12th to the 25th depending on pay schedule
- An electric bill that varies between $60 and $140 seasonally
- A subscription that increased in price partway through the history
Possible (score 50–69)
A recurring pattern is detectable but the signal is weaker. The timing is less regular, the amounts vary more, or there aren’t as many data points yet. These items may benefit from a closer look to confirm whether they’re truly recurring.
Not shown (score below 50)
Patterns that score below 50 are excluded entirely. The signal is too weak to be useful — it’s more likely noise than a real subscription.
How the confidence score is calculated
The score is a weighted combination of four signals:
Interval consistency (40% of score)
How reliably do transactions appear at the expected frequency? For monthly detection, the system checks whether each gap between consecutive transactions falls within 23–37 days. At least 70% of gaps must match for the pattern to qualify.
- 100% of gaps match → full score
- 70% of gaps match → minimum to qualify
- Below 70% → disqualified
Day-of-month consistency (30% of score)
How consistently do charges land on the same calendar day? A bill that always hits on the 5th scores higher than one that bounces between the 12th and the 25th. This is measured by the statistical variance of the billing day.
- Low variance (always the same day) → high score
- Moderate variance (drifts by a week) → medium score
- High variance (appears on different days each month) → low score
Amount consistency (20% of score)
How stable is the charge amount? This only looks at the last 6 transactions, so historical price changes don’t penalize the current pattern.
- Coefficient of variation below 5% (nearly identical amounts) → full score
- CV between 5–30% (some variation, like utility bills) → sliding scale
- CV above 30% → minimum score (still included, just lower confidence)
Occurrence count (10% of score)
More data points increase confidence. A pattern seen 12 times is more trustworthy than one seen 3 times.
Memo bonus (up to 5 extra points)
If most transactions in a detected pattern also share a similar normalized memo, up to 5 bonus points are added. This is a minor boost, never a requirement.
Frequency detection
The tracker looks for three frequencies:
| Frequency | Expected interval | Tolerance | Minimum occurrences |
|---|---|---|---|
| Monthly | 30 days | ±7 days | 3 transactions |
| Quarterly | 91 days | ±10 days | 3 transactions |
| Yearly | 365 days | ±20 days | 2 transactions |
A transaction series must match one of these patterns. Irregular frequencies (biweekly, semi-annual) are not currently detected.
Why something might not appear
There are several reasons a recurring expense might not show up:
Not enough transactions
Monthly and quarterly patterns require at least 3 occurrences. Yearly patterns require at least 2. If you recently started budgeting or recently added a subscription, there might not be enough data yet. Keep logging transactions and the pattern will appear over time.
Subscription appears cancelled
If the last transaction in the pattern is too old, the tracker assumes the subscription has been cancelled and excludes it. The staleness thresholds are:
- Monthly: last charge must be within 40 days
- Quarterly: within 110 days
- Yearly: within 400 days
Timing is too irregular
If fewer than 70% of the gaps between transactions fall within the expected window, the pattern is rejected. This can happen with expenses that are technically monthly but get paid at wildly inconsistent intervals — sometimes 19 days apart, sometimes 46 days apart. The wider the timing spread, the lower the interval score.
Category is too noisy
In high-volume categories (many transactions per month), the tracker clusters by similar amounts. If a subscription amount is close to other unrelated purchases in the same category, it may get grouped incorrectly and fail the interval check. Consider moving the subscription to its own category for cleaner detection.
Amounts vary too much within a cluster
For high-volume category clustering, transactions must be within 20% of each other’s amounts to be grouped together. If a charge has increased by more than 20% over its history, the older charges might not cluster with the newer ones.
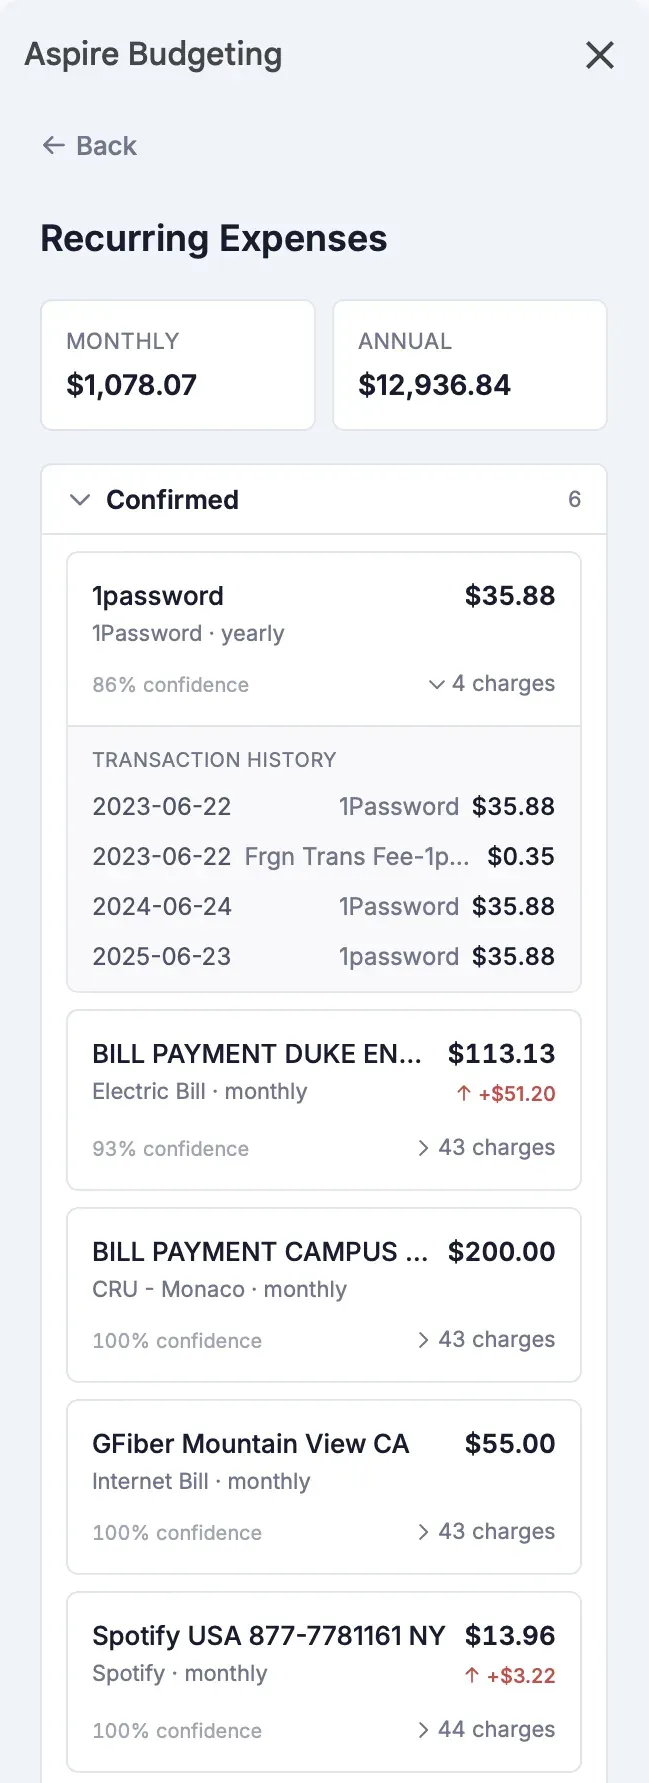
The summary cards
At the top of the Recurring Expenses view, two cards show:
- Monthly — the estimated total monthly cost of all detected recurring expenses. Quarterly expenses are divided by 3, yearly by 12.
- Annual — the monthly total multiplied by 12. This gives you a sense of your total recurring commitment per year.
Both use the most recent charge amount for each expense, not the historical average.
Cost increase detection
Each expense shows whether the most recent charge is higher than the first detected charge. If so, a red indicator shows the total increase (e.g., “+$1.07”). This helps you spot subscriptions that have quietly raised their prices over time.
Transaction history
Each recurring expense has an expandable “X charges” section that shows every transaction the algorithm grouped together. This is useful for verifying the detection makes sense and understanding what data informed the classification.
Tips for better detection
- Use dedicated categories for fixed bills. A “Spotify” or “Internet Bill” category with one charge per month is trivially detected.
- Be consistent with your categories. If you sometimes log iCloud under “Everything Else” and sometimes under “iCloud Storage”, the tracker may miss it in the noisy category.
- Let time build the data. The more months of history you have, the stronger the signal. A 3-month-old subscription is “possible” — a 12-month one is “confirmed.”
- Check the Possible section. Items there might be real subscriptions that just need another month or two of data to graduate to a higher tier.