Budget forecast
Learn how Budget Forecast projects your spending for each category and warns you before you overspend.
Published June 17, 2026
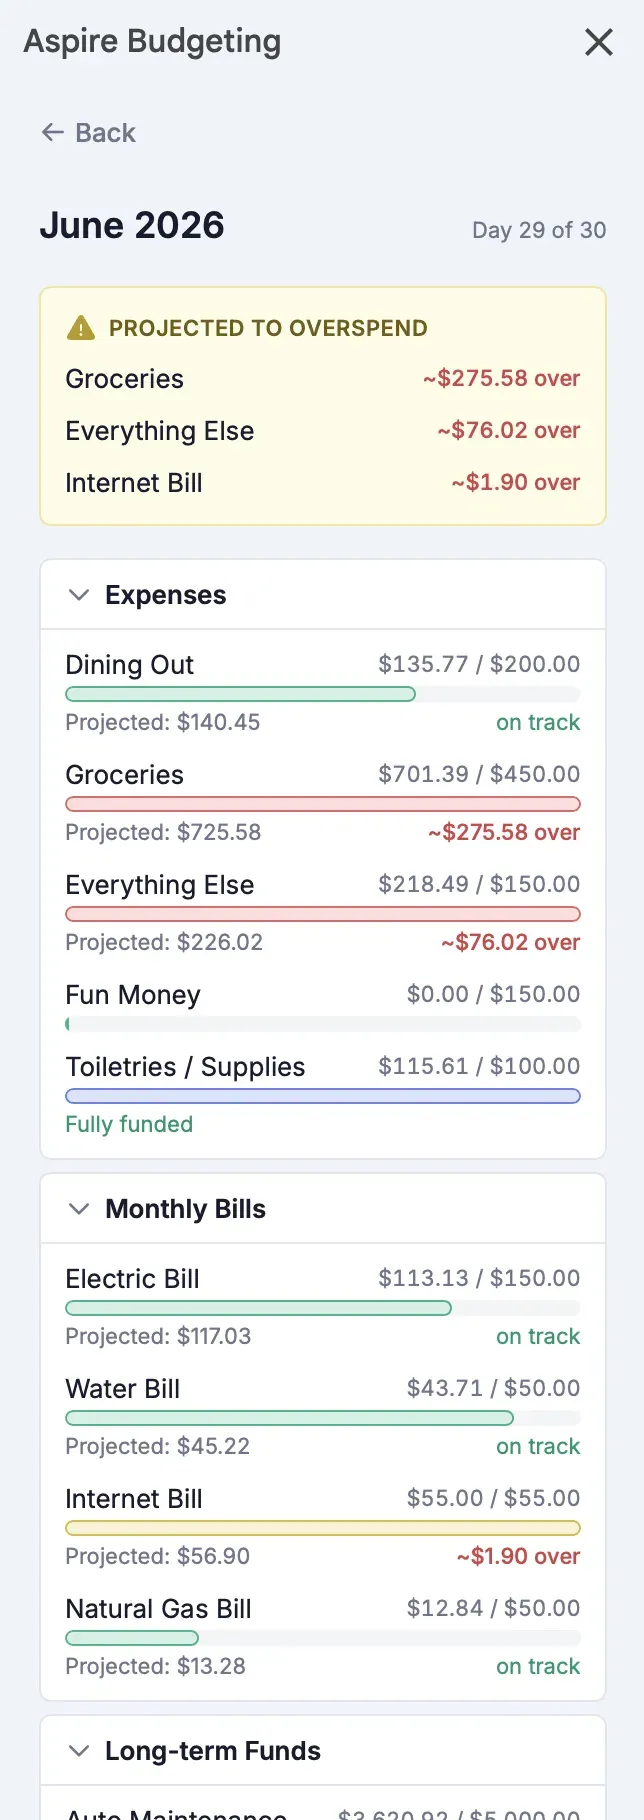
Budget Forecast gives you a real-time view of where your budget is headed this month. It reads your current spending and projects what each category will look like by month-end — so you can adjust before you overspend, not after.
Requires Aspire Turbo. Budget Forecast is a subscriber-only feature available in the Aspire Budget add-on sidebar.
How it works
When you open Budget Forecast from the sidebar, the add-on:
- Reads your category configuration (groups, categories, monthly targets, and goal amounts) from the Configuration sheet.
- Sums all outflows for the current month from the Transactions sheet, grouped by category.
- Calculates a linear spending projection for each category based on how much you’ve spent so far relative to where you are in the month.
- For goal categories, computes all-time funding progress by summing net transfers in minus lifetime outflows.
- Returns everything organized by category group, ready to display.
The projection math
Budget Forecast uses a simple linear projection to estimate month-end spending:
Projected spending = (Spent so far / Day of month) × Days in monthFor example, if you’ve spent $150 on Groceries by day 10 of a 30-day month:
Projected = ($150 / 10) × 30 = $450If your Groceries target is $400, the forecast shows you’re on pace to overspend by ~$50 — giving you time to cut back.
When projection equals zero
If you haven’t spent anything in a category yet this month (spent = $0), the projection is $0. This is intentional — categories like monthly bills often show $0 until the bill hits, then jump to their full amount. The forecast is most useful for categories with steady, ongoing spending (groceries, dining, fuel, etc.).
Overspending warnings
At the top of the forecast, a yellow warning panel highlights any category where:
Projected spending > Monthly targetThese are categories that, based on your current pace, will exceed their budget by month-end. The warning shows the category name and how much over you’re projected to be (e.g., “~$50 over”).
Groups that contain at-risk categories are auto-expanded when you open the forecast so you can see the details immediately.
Category group progress bars
Each category group shows a collapsible card with a thin progress bar when collapsed. The bar color reflects the worst-case status of any category within:
| Color | Meaning |
|---|---|
| Green | All categories on track — no projected overspending |
| Yellow | At least one category is projected to overspend |
| Red | The group has already exceeded its total budget |
Expanding a group shows individual category rows with per-category progress bars and projection details.
Goal categories
Categories with a savings goal (a target amount you’re building toward over time) display differently:
- Instead of showing monthly spending, they show funding progress — how much has been transferred into the category versus the total goal amount.
- A blue progress bar shows percentage funded.
- Below the bar, you’ll see an estimate like “Fully funded in 4 months” based on your monthly contribution amount.
Goal funding math
Funded amount = Sum of all transfers into the category - Sum of all outflows from the category
Goal progress = Funded amount / Goal amount × 100%
Months to go  = (Goal amount - Funded amount) / Monthly contribution
This is calculated across all time, not just the current month — since goals are long-term by nature.
What Budget Forecast reads
Budget Forecast is read-only. It never writes to your spreadsheet. It pulls data from:
- Configuration sheet — category groups, category names, monthly target amounts, goal amounts
- Transactions sheet — current month outflows per category (for spending projections) and all-time outflows for goal categories
- Category Transfers sheet — all-time transfers between categories (for goal funding calculations)
Tips
- Check early in the month — Projections become more accurate as the month progresses, but early warnings give you the most time to adjust.
- Use it after importing transactions — If you use CSV Import, run Budget Forecast afterward to see the updated picture.
- Focus on the warnings — The yellow warning panel surfaces the categories that need attention. If nothing is yellow, you’re on track.
- Hidden categories are excluded — Categories marked with the ※ symbol in your Configuration sheet don’t appear in the forecast or affect group status.
- Pair with Quick Budget — If the forecast shows you have headroom in most categories, that’s a good sign your Quick Budget allocations are working well.